In-depth analysis of US non-farm data in February: bull-bear game and investment strategy in the gold market
- 2025年3月11日
- Posted by: Macro Global Markets
- Category: News
First, how to interpret non-agricultural data review
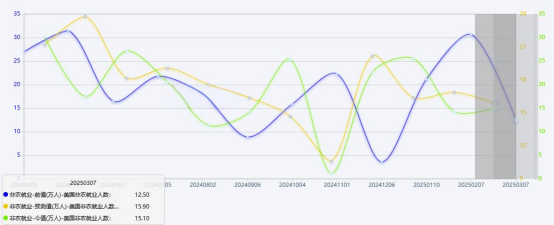
Last Friday (21:30 p.m. on March 7), the U.S. Bureau of Labor Statistics released the February non-farm employment report, with 151,000 new jobs, slightly higher than the previous value of 143,000 but lower than the market expectation of 159,000. The unemployment rate unexpectedly rose to 4.1%, and the hourly wage growth slowed to 3.1%. Data showed that the U.S. labor market showed signs of a mild cooling, which resonated with the previous weak ADP employment data, further strengthening the market's expectations for the Federal Reserve to cut interest rates this year.

2. The logic game between long and short positions in the gold market
1. Bullish factors
Expectations of rate cuts rise:The market probability of the first interest rate cut in May has risen to 52%, and the actual interest rate has fallen to -1.2%, highlighting the advantages of gold as a zero-interest asset.
Safe-haven demand support:The situation in the Middle East remains tense (escalation of the Israel-Lebanon conflict and intensification of sanctions on Iran), global central banks continue to purchase gold (net purchases of 78 tons in January-February 2025), and SPDR Gold ETF holdings have increased to 1,108.3 tons.
US dollar index under pressure:After the data was released, the US dollar index fell 0.3% to 103.4, and gold denominated in US dollars became more attractive to non-US investors.
2. Negative factors
Policy uncertainty cools down:Trump suspended the tariff increase policy (the exemption period lasts until April 2), and some safe-haven funds took profits.
Technical retracement pressure:After gold prices hit an all-time high of $2,956 on February 24, short-term overbought signals were obvious and the RSI index entered the neutral zone.
3. Technical Analysis and Trading Strategies
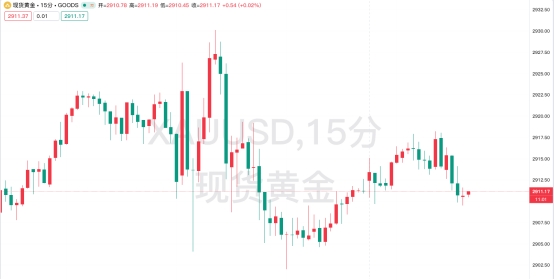
Gold (XAU/USD)
Daily level:The price fluctuates around the middle track of the Bollinger Band at $2,910. The shortening of the MACD red column shows that the bullish momentum is weakening. We need to pay attention to the breakthrough direction of the $2,930 pressure point and the $2,880 support point.
4-hour level:The moving average system is sticky, and the RSI quota of 48.43 shows a long-short balance. The recommended range operation is: sell high and buy low at 2902-2930 US dollars, and stop loss at 5 US dollars.
(2) Non-agricultural data exceeded expectations:The good U.S. job market is bullish for the dollar and bearish for gold.
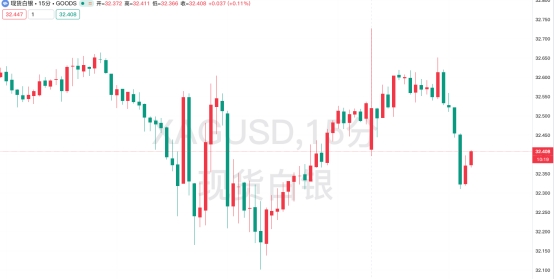
Silver (XAG/USD)
Daily level:The price is fluctuating upward along the 20-day moving average of $32.50. The RSI index of 52.3 shows a neutral to bullish trend. It needs to break through the key resistance of $32.770.
1 hour level:The Bollinger Bands are closing, and the recommended operation range is 32.100-32.660 US dollars. If it breaks through 32.770 US dollars, it can be chased to 33.170 US dollars, with a stop loss of 0.2 US dollars.
In the short term, the gold market will show the characteristics of "policy market + data market", and non-agricultural data will become the key variable to break the volatile pattern. From a medium- to long-term perspective, high global geopolitical risks, continued central bank gold purchases and a downward trend in real interest rates constitute the core support for gold prices. Investors need to pay close attention to: the Federal Reserve’s March interest rate decision (March 19), the implementation of Trump’s tariff policy on April 2, and the evolution of the situation in the Middle East.
Transaction risk warning: Any investment involves risks, including the risk of financial loss. This advice does not constitute specific investment advice and investors should make decisions based on their own risk tolerance, investment objectives and market conditions.