[Non-farm Forecast] March Non-farm Employment Report Outlook: Gold Investment Guide under Labor Market Cooling and Policy Game
- 2025年4月2日
- Posted by: Macro Global Markets
- Category: News

[Non-farm Forecast] March Non-farm Employment Report Outlook: Gold Investment Guide under Labor Market Cooling and Policy Game

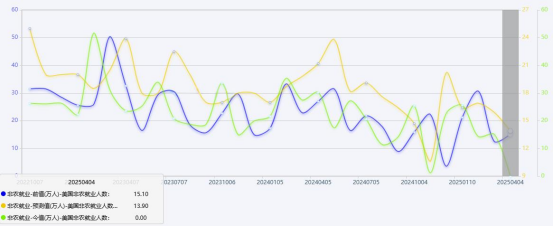
The United States will release the March non-farm employment report at 20:30 Beijing time on April 4 (summer time). The average hourly wage is expected to increase by 3.9% year-on-year, slightly lower than the previous value of 4%, and the month-on-month increase will remain unchanged at 0.3%; the unemployment rate is expected to remain unchanged at 4.1%.
As Trump's tariff policy continues to ferment and global trade frictions intensify, the U.S. job market is facing the dual pressures of "policy shock + economic transformation." Manufacturing employment has been negative for three consecutive months, and the willingness to recruit in the service industry has cooled. The data performance will directly affect the market's expectations of the pace of the Fed's interest rate cuts and become a key variable in the trend of gold prices.
Analysis of Small Non-farm ADP Data
Data characteristics: As a "preview" of non-agricultural data, ADP private sector employment increased by only 77,000 in February (previous value 183,000), the lowest since August 2024. The forecast value for March is 118,000.
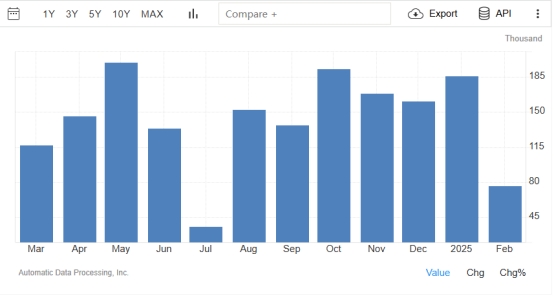
The ADP employment figures for March will be released on Wednesday, April 02, 2025 at 20:15.
Outlook for the big non-farm data
Core quota: previous value 151,000 (February), predicted value 139,000 (March). If the data is lower than 140,000 and the unemployment rate exceeds 4.2%, it may trigger expectations of a rate cut by the Federal Reserve, pushing gold above $3,150; if the data exceeds 180,000 and the wage growth rate picks up, the gold price may fall back to the $3,050 support.
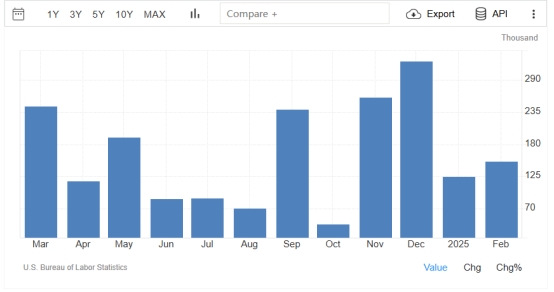
The March non-farm payrolls change data will be released at 20:30 on April 04, 2025 (Friday).
(1) Non-farm data is lower than expected: the weak U.S. job market is bearish for the dollar and bullish for gold;
(2) Non-farm data exceeded expectations: The U.S. job market is good, which is bullish for the U.S. dollar and bearish for gold.
3. Divergence in Institutional Forecasts
Goldman Sachs: Forecasts 135,000 new jobs, warns that manufacturing contraction may trigger a chain reaction, maintains expectations of a July rate cut
Morgan Stanley: 180,000 new jobs are expected, emphasizing that the slowdown in wage growth will ease inflationary pressure, and recommends shorting gold at highs
Huatai Futures: The overall employment data is weak, and expectations for a Fed rate cut still exist. The market expects a 50-75 basis point rate cut this year.
4. Non-agricultural trading strategy: long and short positions of gold and silver
Gold market analysis
Core drivers: Global central bank gold buying spree, geopolitical risks and expectations of a Fed rate cut support gold prices. As of March 31, holdings of SPDR Gold Trust, the world's largest gold ETF, increased to 931.94 tons, an increase of 2.29 tons from the previous day. In January 2025, global central banks purchased a net 18 tons of gold, with central banks in emerging markets becoming the main buyers. If the Federal Reserve cuts interest rates by 50-100 basis points this year, gold ETFs may increase their holdings by 360 tons.
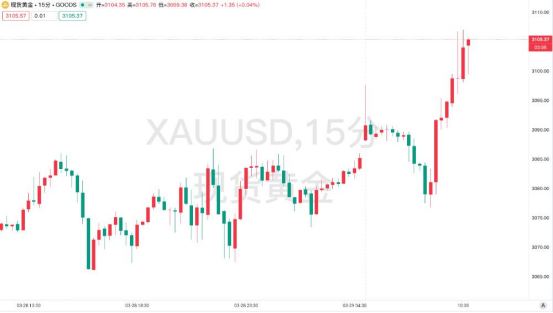
Technical analysis: The international gold price opened at $3089.7 per ounce on March 31, and reached an intraday high of $3106.57, a record high. On the daily chart, the gold price is trading above the 20-day moving average (US$3,080), and the red bar of the MACD indicator continues to expand, but the RSI has entered the overbought zone (72), indicating a short-term pullback demand. The key support is $3,050 (200-day moving average) and the pressure is $3,180 (institutional target price).
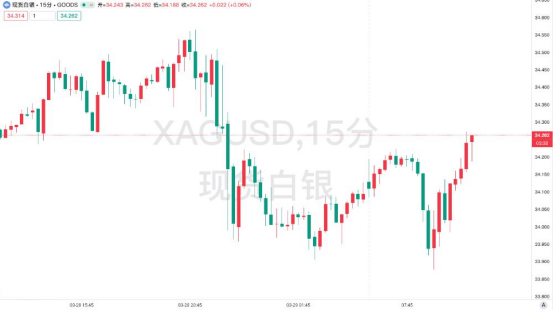
Supply and demand structure: European and American silver ETF holdings continue to increase, reflecting strong investment demand. On March 31, the spot silver price opened at $34.11 per ounce
Technical analysis: Silver prices stabilized at the $33.50 support level on the daily chart, and the 20-day moving average diverged upward. The 15-minute chart shows that the 34.00-34.20 range forms a short-term center, and the target after breaking through is $34.80.
gold:
The data is lower than 140,000 and the unemployment rate rises: fall back to the $3066-3070 range and stabilize and go long, stop loss at $3060, target at $3085-3095.
The data is better than 180,000 and wages rebound: rebound to the 3100-3105 US dollar range and be blocked and short sell, stop loss at 3110 US dollars, target 3085-3075 US dollars.
silver:
The data is neutral and slightly bearish: go long if it falls to the range of $33.50-33.80 and stabilizes, stop loss at $33.30, and target at $34.50-34.80.
The data is weaker than expected: rebound to the $34.40-34.60 range and short if encounter resistance, stop loss at $34.70, target at $34.10-33.90.
5. Important events of non-agricultural week
Trump's tariff policy: Full reciprocal tariffs announced on April 2, with an average tariff rate of over 15%, could trigger an escalation of the global trade war
Federal Reserve interest rate decision: The minutes of the April 3 meeting may release a signal of a rate cut, and the current probability of a rate cut has risen to 65%
Trading risk reminder: Pay attention to sub-item data of government departments, medical industry, etc., and be wary of seasonal adjustment deviations. Any investment involves risks, including the risk of loss of capital. This advice does not constitute specific investment advice and investors should make decisions based on their own risk tolerance, investment objectives and market conditions.